
Approaching the new year, many market commentators expected another solid year for stocks, supported by tax cuts, favorable expensing for large corporate capital projects, promising signs of healthy earnings, and a Federal Reserve inclined to lower interest rates.
That outlook changed abruptly on February 28 when the U.S. and Israel launched coordinated attacks on Iran. The initial objective was to eliminate Iran’s ability to build or deploy nuclear weapons and to degrade its missile-launching capability. Though several senior Iranian leaders have reportedly been killed, hopes for a popular uprising against the clerical regime have not materialized. Meanwhile, Iran has effectively blocked the Strait of Hormuz, the narrow waterway that supplies roughly 80% of the oil head to Asia.
Not surprisingly, global markets reacted negatively. In the weeks following the start of the conflict, foreign markets fell by more than 10%. U.S. stocks also came under pressure, with domestic equities dropping nearly 8% in March before a rally on the final day of the month, as reports suggested a possible path toward peace.
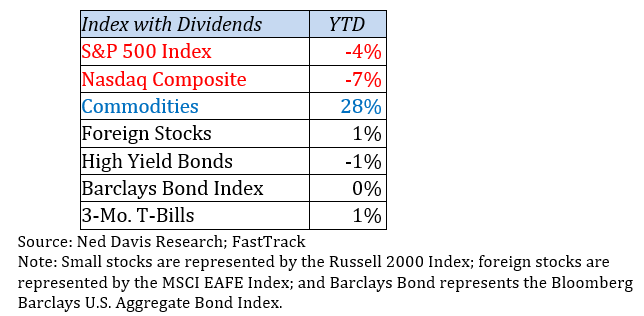
As the table above shows, stocks and bonds both had a weak start to the year. Without the nearly 3% surge on the last day of March, the results would have been noticeably worse. Commodities have been the clear standout, with strength in oil, gold, agriculture, aluminum, and other areas. Oil rose more than 50% in March as the Iran conflict intensified. Gold has remained exceptionally strong, averaging gains of more than 30% a year over the past three years as investors responded to inflation concerns, economic and political uncertainty, and now war in the Middle East. Even agricultural commodities have moved higher, making this a broad-based commodity rally.
FSA portfolios have held up relatively well through this period of turbulence and uncertainty. As stocks began to retreat, we started trimming equity positions and moving a portion of the proceeds into the relative safety of money market funds. By the end of the month, most strategies were holding roughly 50% to 60% of their maximum equity allocation.
From this allocation, portfolios can participate to some degree if stocks rebound on news of a ceasefire, while also helping cushion the impact of any further sell-off. As holdings move through the FSA Safety Net®, we will continue shifting proceeds into money market funds and other alternative assets as appropriate.
Looking Ahead
Events in the past several years have highlighted how difficult it is to forecast the market with confidence. From a global pandemic to a tariff war and now a shooting war, outside shocks to the economy seem to be occurring more frequently. That makes traditional forecasting even more precarious than usual. Thus, at FSA, we rely on price charts to show us where conditions stand and then respond to the market environment in front of us.
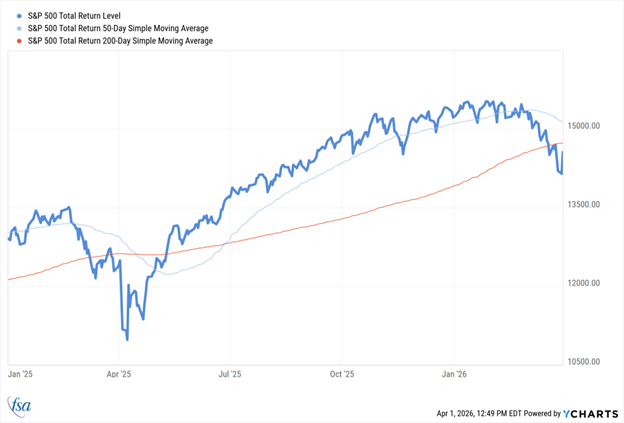
The chart below shows the S&P 500 Index alongside its 50-day and 200-day moving averages. When stocks break below the 200-day moving average, we view that as a sign of increasing weakness and a signal to adopt a more cautious posture. We are also monitoring the individual holdings in your portfolio and selling any funds that break through the FSA Safety Net®. In March, foreign funds and small-cap funds were among the biggest drags, leading us to significantly reduce those holdings.
Once stocks climb again above the 200-day moving average, we will begin redeploying the cash raised in March. If markets continue moving downward, triggering the FSA Safety Net® on additional funds, you will see the allocation to money market funds increase from current levels.
Portfolio Updates
Please note: Because we manage client portfolios individually, your holdings may differ slightly from the composites described below.
Strategies Using the FSA Safety Net®
Income (Strategy #1)
There was little movement in fixed income during the first quarter, with both high-yield and high-quality bonds producing returns near zero. The brightest spots in the portfolio were the emerging markets debt fund and the catastrophe bond fund. The money market allocation now stands at 20%, with most of it being held in Schwab’s higher-yielding fund.
Income & Growth (Strategy #2)
This balanced, conservative strategy held up well during a turbulent first quarter. It seeks to generate steadier returns through an even mix of bonds and equities. Every fund in the portfolio outperformed the S&P 500 during the quarter. As stocks weakened in March, we reduced the equity allocation from 50% to 30% in qualified accounts and to 25% in taxable accounts, and we sold one of the foreign bond funds. At the quarter’s end, the portfolios held 43% in bond funds and 27% in money market funds, with taxable accounts at 32% in money market funds.
Conservative Growth (Strategy #3)
This strategy can hold up to 75% in equities, and it began the year at that level. As stocks retreated in March, we raised cash and reduced the equity allocation from 75% to 40%. That figure includes an inverse fund, which rises when stocks fall. We also sold the emerging markets debt fund. Currently, these portfolios hold 45% in equities, 5% in an inverse fund, 10% in high-yield bond funds, and 40% in money market funds.
Core Equity (Strategy #4)
This strategy began the year with more than 95% invested in stock funds, including allocations to small-cap and foreign funds. During the quarter, we added a natural resources fund to benefit from rising energy and commodity prices. As the sell-off intensified, we reduced the equity allocation to 67% and added an inverse fund. At quarter-end, the portfolios held 67% in stock funds, 10% in an inverse fund, and 23% in money market funds.
Tactical Growth (Strategy #5)
This aggressive but nimble strategy performed relatively well in the first quarter of 2026, helped by commodity and foreign holdings. As stocks sold off in March, we reduced the equity allocation from 95% to 65%. The strategy now holds 10% in an inverse fund, 10% in a commodity fund, and 15% in money market funds.
Active Strategies WITHOUT the FSA Safety Net®
Sector Rotation
This aggressive strategy produced a positive return for the quarter, supported by positions in basic materials, telecommunications, and semiconductor stocks for much of the period. In mid-March, it added an inverse fund. For the April rotation, the portfolio holds semiconductors, telecommunications, biotechnology, basic materials, industrials, and the inverse fund.
Global Rotation
This is another more aggressive strategy within the FSA line-up that also can become defensive when stocks fall. The portfolio held nearly 50% in foreign stocks in late February, but we reduced the allocation by a third as stocks fell in March. We also sold one of the large-cap domestic funds. At quarter end, the portfolios held 16% in large-cap U.S. funds, 16% in small-cap funds, 32% in foreign funds, and 36% in money market funds.
Strategies That Remain Fully Invested Through ALL Market Cycles (Passive)
Global Balanced
Despite the market turbulence, Global Balanced portfolios finished the quarter largely in line with expectations. Diversification helped keep the overall portfolio from slipping into negative territory.
Global Moderate
This strategy held up well during the first quarter, with gold and real estate helping to offset modest losses in other asset classes. It remains a clear example of the value of diversification.
Global Growth
Despite maintaining a 90% allocation to stocks, this strategy held up relatively well during the quarter. Gold, real estate, and emerging markets helped offset more modest weakness in other asset classes.
As always, please contact your advisor if there have been any changes in your circumstances that could affect how we manage your portfolio.
Ronald Rough, CFA
Chief Investment Officer
Disclosures are available at www.fsawealthpartners.com/disclosures/market-update.
FSA’s current written Disclosure Brochure and Privacy Notice discussing our current advisory services and fees is available at www.fsawealthpartners.com/disclosures or by calling 301-949-7300.