
We’ve all heard the familiar line borrowed from Mark Twain: If you don’t like the weather, just wait a few minutes. The same could be said for the markets in April when dramatic swings in investor sentiment occurred almost daily. These days, it’s not just Fed Chairman Powell moving the markets – now, a tweet from the President or a comment from the White House can be enough to shift the direction of stocks and bonds in an instant.
The most volatile moments came early in the month when the S&P 500 fell more than 10% over two days, only to rebound with a gain of over 9% on one day alone. The Dow and Nasdaq Composite followed similarly erratic paths, delivering some of the most turbulent market action we’ve seen in recent years.
April turned out to be a historic month for a few reasons:
- A rare trifecta of declines occurred on April 21, when U.S. stocks, bonds, and the dollar all fell by more than 1%. Traditionally, Treasuries and the dollar serve as safe havens during times of market stress, but April defied those norms amid what some dubbed the “Sell America” trade – a broad rotation out of U.S. assets.
- Historic volatility followed the President’s “reciprocal” tariff strategy announcement on April 2. The S&P 500’s two-day drop of 10% over April 3-4 marked only the fourth such decline of that magnitude since WWII, with others occurring during the 1987 crash, the 2008 financial crisis, and the 2020 pandemic. A partial reversal came on April 9, when news of a 90-day pause in some “reciprocal” tariffs sent the S&P 500 soaring – its third-largest one-day gain since WWII and its biggest one-day gain since 2008.
At their April 8 closing lows, the major indices (Dow, S&P 500, and Nasdaq) were down 16%, 19%, and 24% from their respective 52-week closing highs, with the Nasdaq officially entering bear market territory and the S&P 500 close to it.
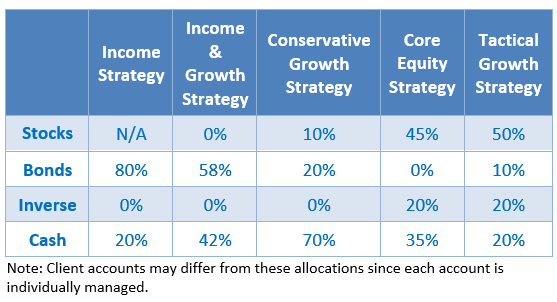
FSA had already begun increasing cash allocations in portfolios in the first quarter as positions hit their FSA Safety Net®. As the tariff-induced market turmoil intensified in April, we continued this shift to money market positions and, where appropriate, we initiated inverse positions to reduce equity exposure.
Below are the month-end allocations for the FSA strategies that employ the FSA Safety Net®:
Looking Ahead: Where Do We Go from Here?
By the end of April, markets showed signs of stabilization as the volume of political “shock and awe” rhetoric subsided, prompting the markets to recoup some of their losses. However, U.S. equity markets remain well below their highs and below major trend lines, as uncertainty continues to loom – especially regarding the administration’s tariff policy and its broader economic impact.
Some cautionary signals that markets might not yet be in the clear:
- On April 14, the S&P 500 triggered its first “death cross” since March of 2022 – when the 50-day moving average of the index crossed below the 200-day moving average. Historically, this technical signal can foreshadow further declines. Ned Davis Research notes that after such a signal, it has taken 86 days, on average, for the market to find a bottom.
- As of April 28, around one-third of S&P 500 companies had reported first-quarter earnings. According to Barron’s, while 73% of these companies have beaten expectations, 60% have issued full-year guidance below Wall Street expectations, and there is a growing number of companies withdrawing full-year guidance altogether, reflecting the significant economic uncertainty that company executives face.
- First-quarter Gross Domestic Product (GDP) declined at an annual rate of 0.3%. This marked a stark reversal from the 2.4% increase we saw in the fourth quarter of last year. If the second quarter also reflects negative growth, the U.S. will meet the technical definition of a recession.
At this point, the technical indicators we follow have not yet given us a clear signal to re-enter the markets in a meaningful way. That said, even in downward-trending environments, there can be pockets of strength in certain areas of the markets. We continue to monitor market developments closely, while remaining positioned to act on opportunities as they emerge.
Please remember to inform your advisor of any changes in your life that might affect your investment objectives and how we manage your money.
Mary Ann Drucker
Assistant Portfolio Manager
Disclosures are available at www.fsawealthpartners.com/disclosures/market-update.
FSA’s current written Disclosure Brochure and Privacy Notice discussing our current advisory services and fees is available at www.fsawealthpartners.com/disclosures or by calling 301-949-7300.